To view our slide show on South Asia and the issues they are dealing with, click the link below:
South Asia Powerpoint
Thursday, March 10, 2011
Final Statement
Overall South Asia is not a main contributor to climate change, they are currently suffering from other world region's decisions. They are doing what they can to reduce poverty and natural disasters, but they cannot do it alone. Governments in South Asia most definitely need to step up and concentrate more on their poverty-stricken areas, and less on expanding urbanization. Their priorities need to shift to dealing with problems in the slums, but even they cannot change everything. To make any drastic change it will take a world movement and cooperation to make a change that will benefit the whole world.
Tuesday, March 1, 2011
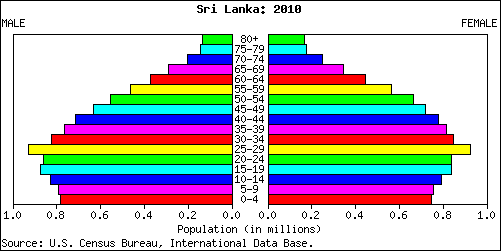
Age Pyramid
Sri Lanka
http://tfw.cachefly.net/snm/images/nm/pyramids/ce-2010.png
Population : 20,303,477
Life Expectancy: 71.4 years
Infant Mortality: 12.7 per 1,000 live births
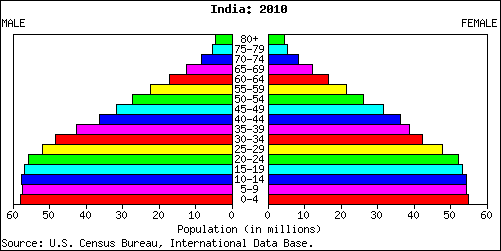
India
http://tfw.cachefly.net/snm/images/nm/pyramids/in-2010.png
Infant mortality: 50.3 per 1,000 live births
Life Expectancy: 63.7 years
Population: 1,155,347,678
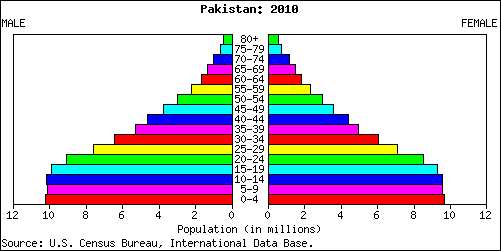
Pakistan
http://tfw.cachefly.net/snm/images/nm/pyramids/pk-2010.png
Population : 162,220,762
Life Expectancy: 66.1 years
Infant Mortality: 41.2 per 1,000 live births
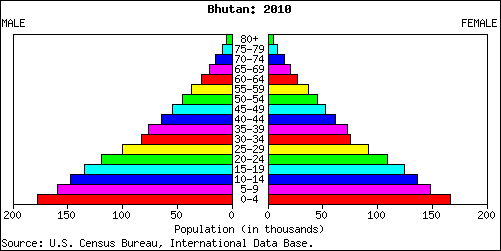
Bhutan
http://tfw.cachefly.net/snm/images/nm/pyramids/bt-2010.png
Population : 697,335
Life Expectancy:66.1 years
Infant Mortality: 52.4 per 1,000 live births
http://tfw.cachefly.net/snm/images/nm/pyramids/ce-2010.png
Population : 20,303,477
Life Expectancy: 71.4 years
Infant Mortality: 12.7 per 1,000 live births
India
http://tfw.cachefly.net/snm/images/nm/pyramids/in-2010.png
Infant mortality: 50.3 per 1,000 live births
Life Expectancy: 63.7 years
Population: 1,155,347,678
Pakistan
http://tfw.cachefly.net/snm/images/nm/pyramids/pk-2010.png
Population : 162,220,762
Life Expectancy: 66.1 years
Infant Mortality: 41.2 per 1,000 live births
Bhutan
http://tfw.cachefly.net/snm/images/nm/pyramids/bt-2010.png
Population : 697,335
Life Expectancy:66.1 years
Infant Mortality: 52.4 per 1,000 live births
child mortality rates
We chose to share a graph portraying child mortality rates in South Asia. There seems to be a steady increase in life expectancy along with steady decrease child mortality rates.
Infant Mortality
Infant Mortality
Subscribe to:
Posts (Atom)